A Langfuse-style observability UI for dynavec, in the project's brand theme. It shows real query telemetry — latency percentiles, cache hit-rate, query volume, and a filterable traces table with per-trace drill-down.
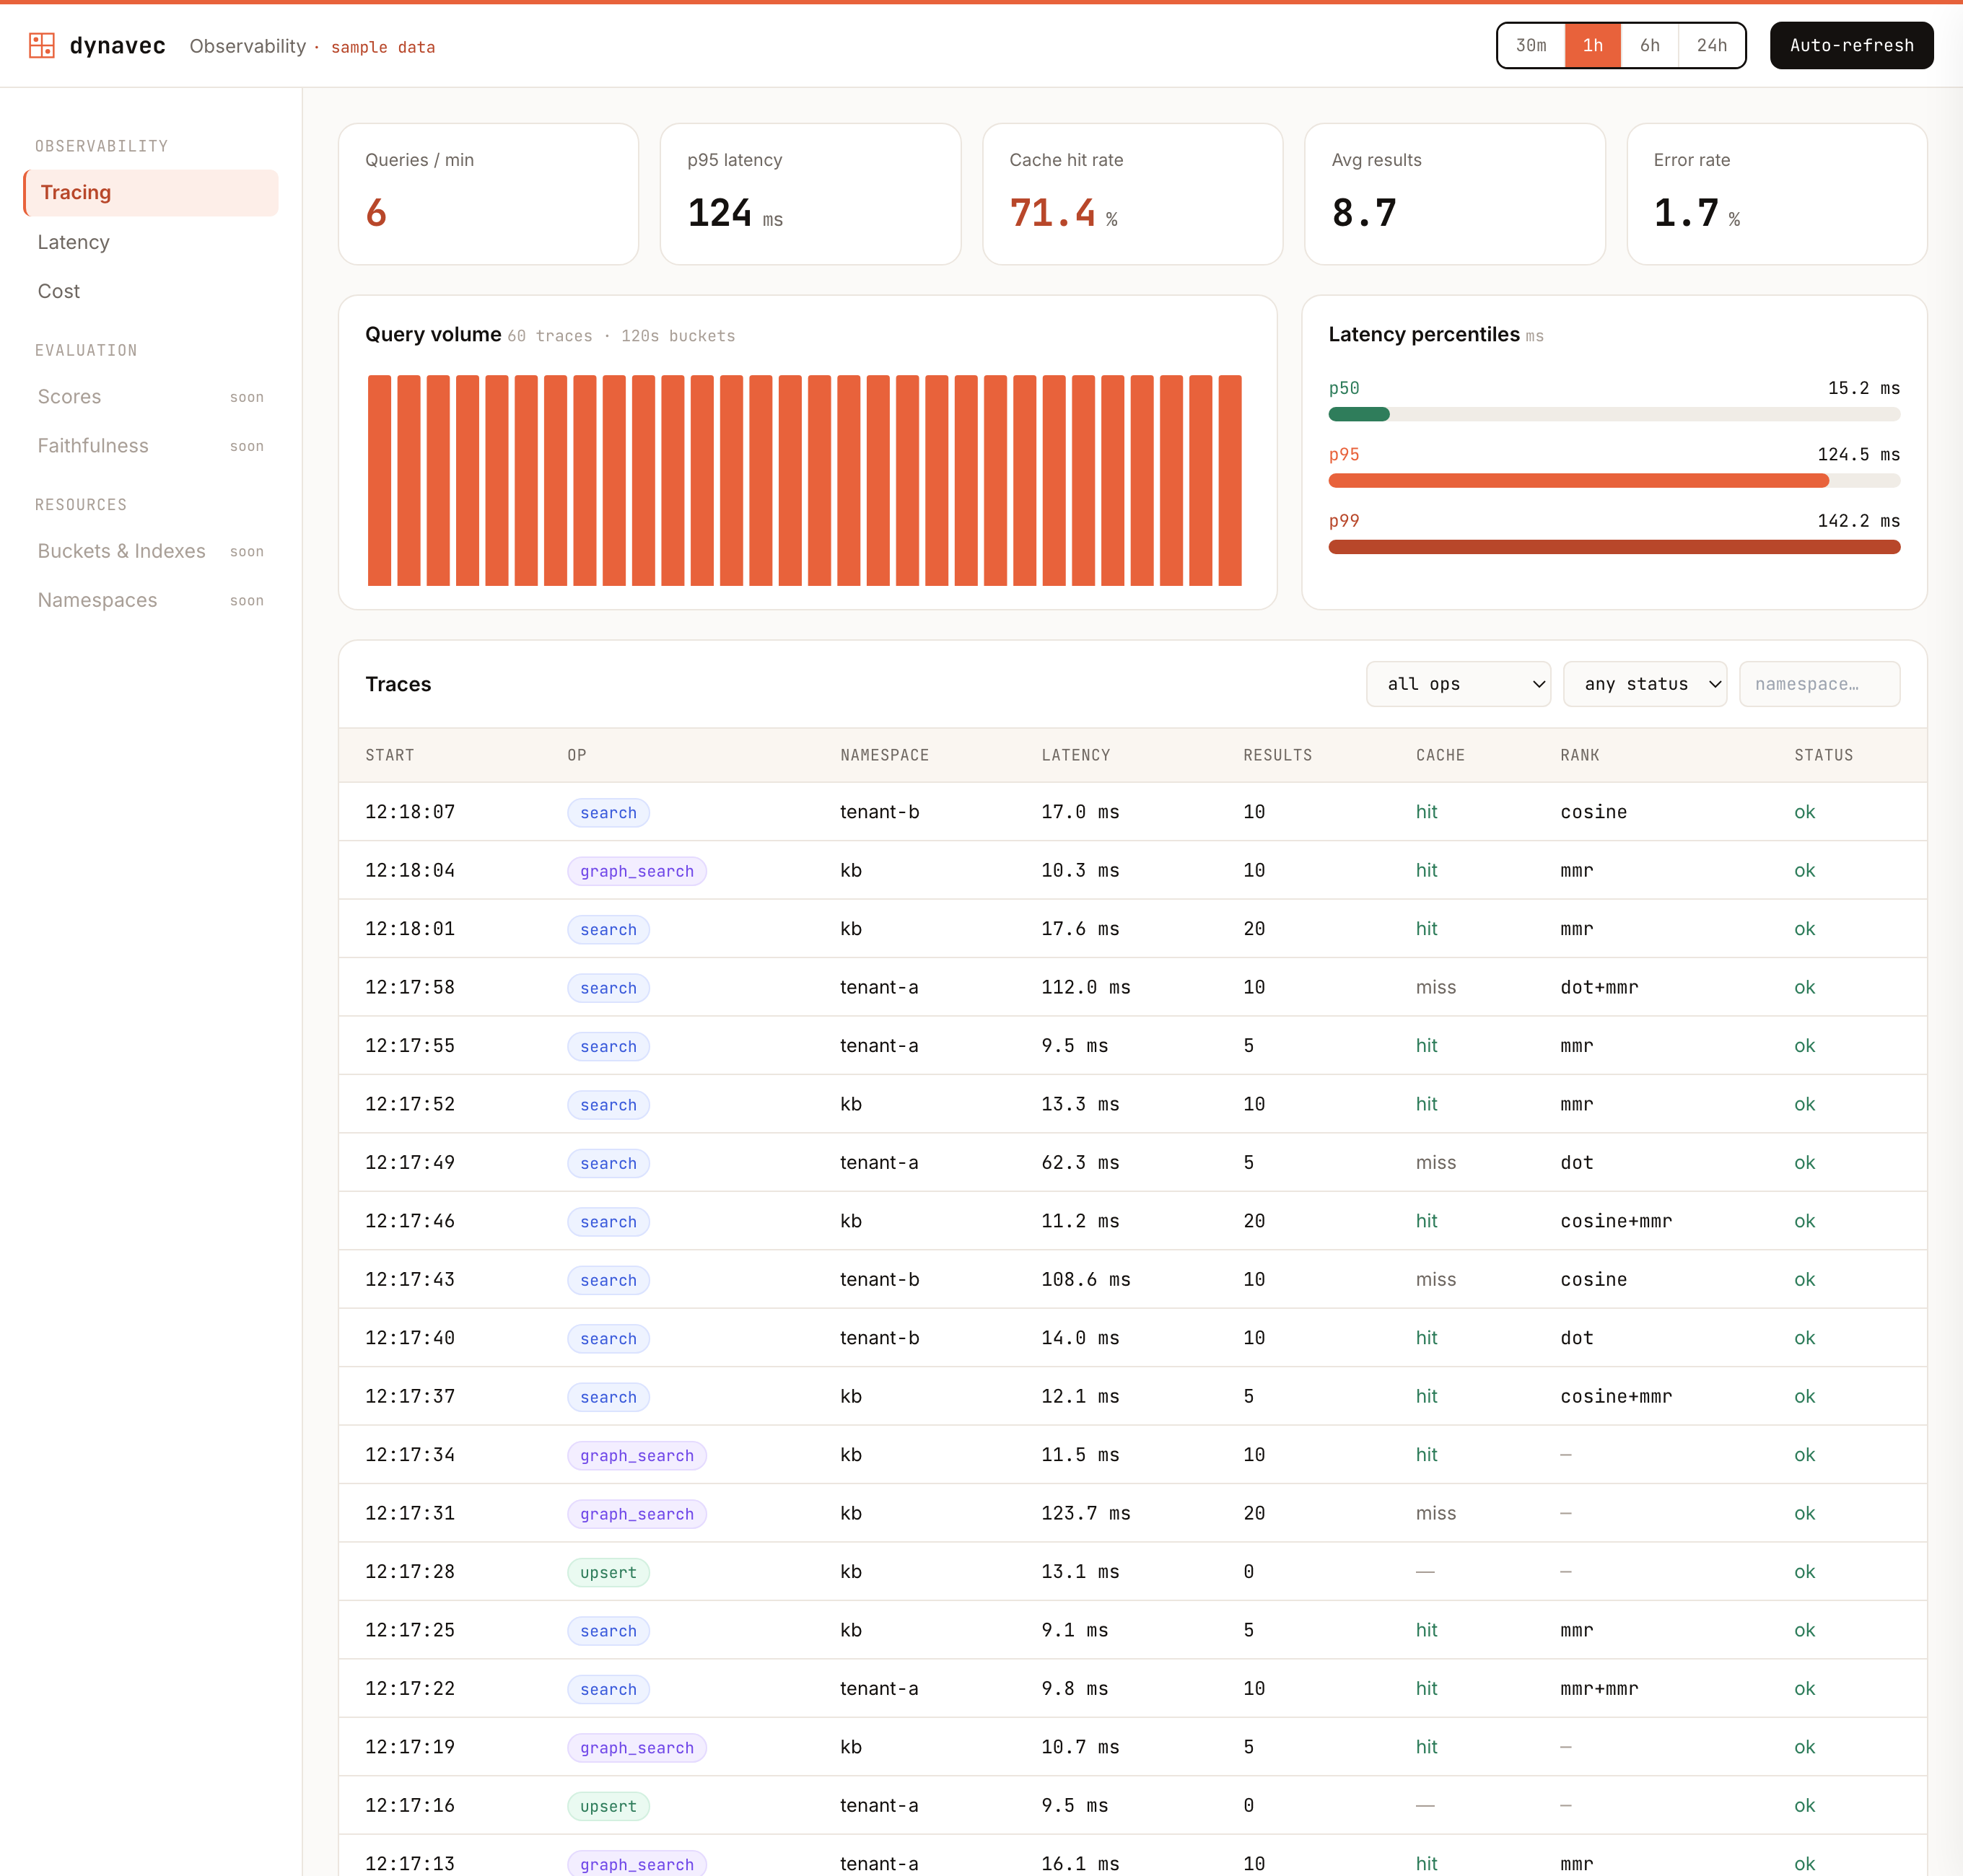
Two pieces, split by language boundary:
your app ──▶ Dynavec(..., telemetry=recorder)      # records real events (Python)
                     │
                     ▼
        dynavec.dashboard.serve(recorder)           # JSON API  (Python, stdlib)
          GET /api/metrics · /api/traces · /api/trace/{id}
                     │  (fetch)
                     ▼
        dashboard/  (Next.js + Tailwind + Recharts) # this app (TypeScript)
- Data source:
src/dynavec/telemetry.pycaptures aTelemetryEventfor every realsearch;src/dynavec/dashboard.py::serve()exposes it as JSON. - This app reads that API via
NEXT_PUBLIC_DYNAVEC_APIand renders it. With no API configured it falls back to sample data (sonpm run devworks alone).
# 1) produce real telemetry + serve the API (no AWS needed)
python examples/dashboard_demo.py            # API on http://127.0.0.1:8779

# 2) run the dashboard against it
cd dashboard
npm install
NEXT_PUBLIC_DYNAVEC_API=http://127.0.0.1:8779 npm run dev   # http://localhost:3000

# build a static export (deployable to any static host / GitHub Pages)
npm run build # -> dashboard/out/| Path | Role |
|---|---|
app/page.tsx |
top-level state (window, filters, polling) + layout |
components/TopBar.tsx |
brand, time-range, auto-refresh, live/sample badge |
components/Sidebar.tsx |
navigation / information architecture |
components/Kpis.tsx |
KPI cards (QPM, p95, cache-hit, avg results, errors) |
components/VolumeChart.tsx |
Recharts query-volume histogram |
components/LatencyChart.tsx |
p50/p95/p99 percentile bars |
components/TracesTable.tsx |
filterable traces table |
components/TraceDrawer.tsx |
per-trace detail drawer |
lib/types.ts |
Metrics / TraceEvent types (mirror the Python API) |
lib/api.ts |
data fetching + sample fallback |
lib/mock.ts |
sample-data generator for standalone dev |
tailwind.config.ts |
brand tokens (coral #e8623b, warm ink, fonts) |
- Telemetry capture on the real
searchpath (opt-intelemetry=recorder) - JSON API:
/api/metrics,/api/traces,/api/trace/{id} - Next.js app: KPIs, volume histogram, latency percentiles, traces table + drawer
- Brand theme, time-range selector, auto-refresh, sample-data fallback
Each item is a self-contained contribution. Comment on the linked issue to claim it. Parent: dashboard epic #122.
Only search records telemetry today.
- Record
TelemetryEvent(op="upsert", ...)inDynavec.upsert(count, latency) - Record
op="graph_search"inDynavec.graph_search - Tests in
tests/test_telemetry.py/tests/test_client_inmemory.py
- Backend: an eval runner that scores a labeled set (recall@k, MRR, nDCG) and stores results; a pluggable LLM-judge for faithfulness/answer-relevance
- API:
GET /api/eval/summary,GET /api/eval/runs - UI: new
components/EvalPanel.tsx+ a "Scores" route/section (wire the sidebar item, currentlysoon); trend charts with Recharts
- Backend:
GET /api/resources(describe S3 vector bucket + index dim/metric, DynamoDB table status) andGET /api/namespaces(per-namespace vector/doc counts) - UI:
components/ResourcesPanel.tsx,components/NamespaceExplorer.tsx; wire the twosoonsidebar items
4. Cost panel (#130)
- Backend:
GET /api/costreusingbenchmarks/cost_modelwith live resource sizes + query volume - UI:
components/CostPanel.tsx(breakdown + Recharts)
The drawer shows total latency only.
- Backend: capture per-stage timings (embed → query → hydrate → rerank) on the event
- UI: a small waterfall in
TraceDrawer.tsx
-
.github/workflows/dashboard-pages.ymlthat buildsdashboard/withNEXT_PUBLIC_BASE_PATH=/dynavec/dashboardand publishesout/(note: touches a workflow file — needs a maintainer withworkflowscope to merge)
- Dark mode toggle (theme parity with the landing page)
- Sessions / Users grouping views
- Column config + saved views
- Component tests (Vitest / Testing Library)
- Keep the brand tokens in
tailwind.config.tsin sync with the site'sstyles.css. - New API fields go in both
src/dynavec/telemetry.pyandlib/types.ts. - Charts use Recharts; keep them theme-colored (coral
#e8623b, green#2f7d5b). - Run
npm run buildbefore opening a PR; keepnode_modules/,.next/,out/out of git.