First of all, thanks for developing this great package! I would like to learn more about the pairwise loss for ranking because the prediction results do not look right to me. A simple example using the iris data is as follows:
## example of pairwise loss using {gbm}
library(gbm)
#> Loaded gbm 2.1.9
#> This version of gbm is no longer under development. Consider transitioning to gbm3, https://github.com/gbm-developers/gbm3

train_x <- as.matrix(iris[, c("Sepal.Width", "Petal.Length", "Petal.Width")])
train_y <- iris$Sepal.Length

## train
model <- gbm.fit(
    x = train_x,
    y = train_y,
    group = rep(1, length(train_y)),
    distribution = list(name = "pairwise", metric = "conc"),
    n.trees = 100,
    interaction.depth = 10,
    n.minobsinnode = 10,
    shrinkage = 0.1,
    bag.fraction = 0.5
)
#> Iter   TrainDeviance   ValidDeviance   StepSize   Improve
#>      1        0.1720          0.0000     0.1000       nan
#>      2        0.1738          0.0000     0.1000       nan
#>      3        0.1689          0.0000     0.1000       nan
#>      4        0.1645          0.0000     0.1000       nan
#>      5        0.1655          0.0000     0.1000       nan
#>      6        0.1682          0.0000     0.1000       nan
#>      7        0.1673          0.0000     0.1000       nan
#>      8        0.1677          0.0000     0.1000       nan
#>      9        0.1668          0.0000     0.1000       nan
#>     10        0.1661          0.0000     0.1000       nan
#>     20        0.1616          0.0000     0.1000       nan
#>     40        0.1355          0.0000     0.1000       nan
#>     60        0.1221          0.0000     0.1000       nan
#>     80        0.1156          0.0000     0.1000       nan
#>    100        0.1105          0.0000     0.1000       nan

## predict
train_pred <- predict(model, train_x)
#> Using 100 trees...
cor(train_y, train_pred, method = "kendall")
#> [1] -0.5427688
plot(train_pred, train_y)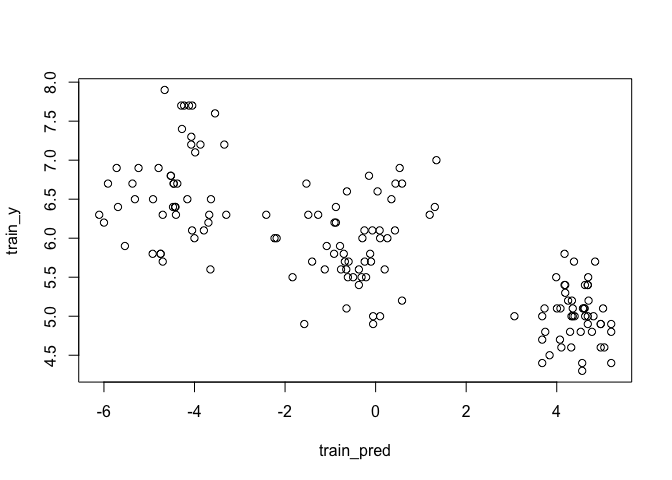
Created on 2024-03-28 with reprex v2.1.0
I expected to see a positive Kendall's correlation coefficient between the model predictions and responses. However, I observed the opposite. Could you kindly point out what I have missed? Thanks.
First of all, thanks for developing this great package! I would like to learn more about the pairwise loss for ranking because the prediction results do not look right to me. A simple example using the iris data is as follows:
Created on 2024-03-28 with reprex v2.1.0
I expected to see a positive Kendall's correlation coefficient between the model predictions and responses. However, I observed the opposite. Could you kindly point out what I have missed? Thanks.