
PyTrendy is a robust solution for identifying and analyzing trends in time series. Unlike other trend detection packages, it is robust to noisy & flat segments, and handles for gradual & abrupt trend cases with a high precision. It aims to be the best package for trend detection in python.
Read more in the documentation: russellsb.github.io/pytrendy/main

Install the package from PyPi.
pip install pytrendy
Import pytrendy, and apply trend detection on daily time series data.
import pytrendy as pt
df = pt.load_data('series_synthetic')
results = pt.detect_trends(df, date_col='date', value_col='gradual', plot=True)
results.print_summary()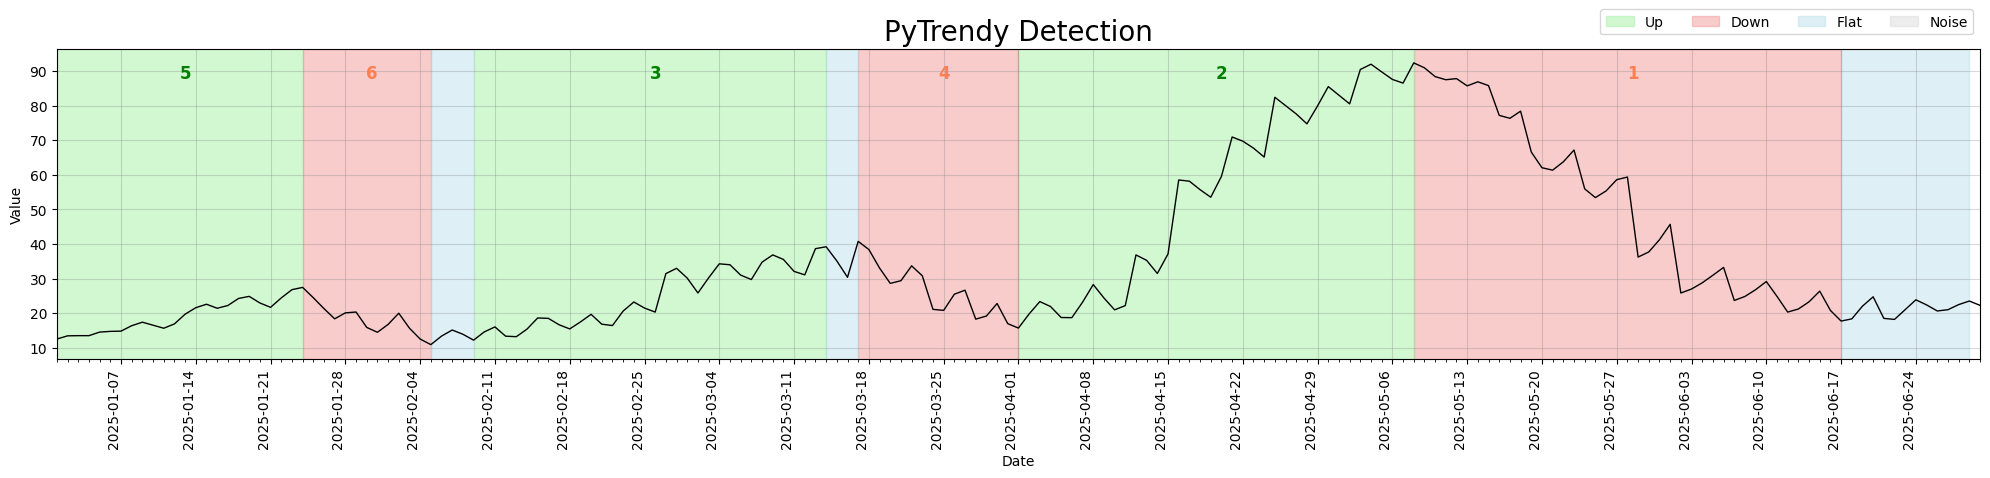
Detected:
- 3 Uptrends.
- 3 Downtrends.
- 3 Flats.
- 0 Noise.

The best detected trend is Down between dates 2025-05-09 - 2025-06-17

Full Results:
-------------------------------------------------------------------------------
            direction       start         end  days  total_change  change_rank trend_class
time_index
1                 Up  2025-01-02  2025-01-24    22     14.013348            5     gradual
2               Down  2025-01-25  2025-02-05    11    -13.564214            6     gradual
3               Flat  2025-02-06  2025-02-09     3     -1.168831            9         NaN
4                 Up  2025-02-10  2025-03-14    32     24.632035            3     gradual
5               Flat  2025-03-15  2025-03-17     2      5.660173            7         NaN
6               Down  2025-03-18  2025-04-01    14    -22.721861            4     gradual
7                 Up  2025-04-02  2025-05-08    36     72.611833            2     gradual
8               Down  2025-05-09  2025-06-17    39    -73.253968            1     gradual
9               Flat  2025-06-18  2025-06-30    12      3.910534            8         NaN
-------------------------------------------------------------------------------