
Usage and community stats for gptme, collected daily by a GitHub Actions cron.
This repo is the source of truth for gptme community and usage numbers. If you quote a stars, downloads, or contributors figure for gptme, take it from here (or from data/summary.json) rather than estimating it.


Embed the star chart elsewhere with:
[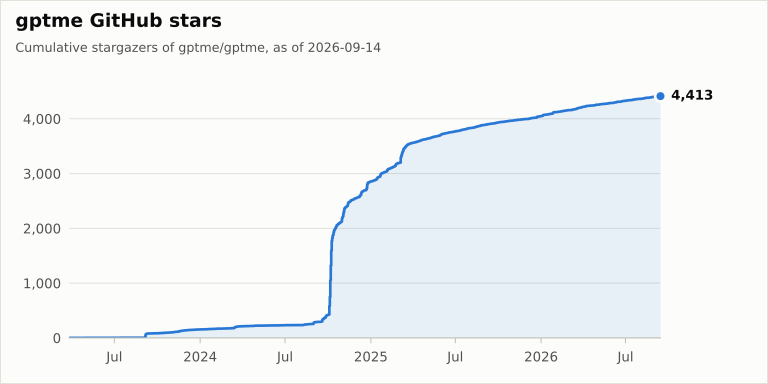](https://github.com/gptme/stats)Latest snapshot: 2026-10-27 (UTC). Machine-readable: data/summary.json.
| Metric | Value |
|---|---|
| GitHub stars | 4,467 |
| Stars gained, last 7 days | 10 |
| Stars gained, previous 7 days | 9 |
| Stars gained, last 30 days | 37 |
| Forks | 460 |
| Watchers | 39 |
| Contributors | 62 |
| Open issues | 7 |
| Open pull requests | 19 |
| Release asset downloads (gptme/gptme) | 6,686 |
| Release asset downloads (gptme/gptme-tauri) | 81 |
| PyPI downloads, 2026-10-26 | 1,280 |
| PyPI downloads, last 7 days | 5,564 |
| PyPI downloads, last 30 days | 30,686 |
| PyPI downloads tracked since 2026-03-17 | 227,306 |

| File | Contents | Update rule |
|---|---|---|
data/stars.csv |
starred_at (UTC) for every current stargazer of gptme/gptme, oldest first |
Incremental (tail pages only); full resync whenever the row count disagrees with the repo's star count |
data/daily.csv |
One snapshot row per UTC date: stars, forks, watchers, open_issues, open_prs, contributors, release_downloads, tauri_release_downloads |
Append-only; a re-run on the same UTC day replaces only that day's row |
data/pypi_daily.csv |
date, downloads for the gptme PyPI package |
Upsert: only dates not already stored are added; stored days are never rewritten |
data/summary.json |
Latest numbers, for websites and scripts | Regenerated by render.py |
- Stars (
daily.csv) is the repo'sstargazers_countthat day. People can unstar, so this number can go down. - Stars added per day (
charts/stars_growth.svg, and the "stars gained" rows above) is the day-over-day change of one daily series: thedaily.csvsnapshots from the first snapshot (2026-09-14) on,stars.csvbefore that. Before snapshots it counts current stargazers by the day they starred; with snapshots it is net of unstars and can be negative. A snapshot is taken around 04:17 UTC, so a snapshot day's change mostly reflects the previous UTC day. Missing snapshot days are filled by linear interpolation, so a collection gap spreads out instead of showing as a spike. The chart covers the full history on a log scale, so a 1/day week stays readable next to the October 2024 launch week (~1,400 stars), and doubling looks the same at any level. stars.csvneeds a user token to update. GitHub returns 401 for unauthenticated stargazer listings and 403 for the workflow'sGITHUB_TOKEN(REST and GraphQL alike), so the daily job can't refresh it and keeps it as is. Nothing depends on it staying current: the cumulative chart continues from thedaily.csvsnapshots after its last row, and the growth chart and "stars gained" rows use snapshots for every day they exist. Runningcollect.pylocally withGITHUB_TOKEN=$(gh auth token)fills it in, fetching only the newest pages (a few requests) unless it is far behind.stars.csvholds only current stargazers. When someone unstars, their row disappears at the next resync, so the cumulative chart shows today's stargazers by the date they starred, not a historical peak.daily.csvrecords what the total actually was on each day. Logins are deliberately not stored: the charts only need timestamps, and there is no reason to publish a permanent, append-only list of who starred.- Watchers is
subscribers_count(people watching the repo), not the legacywatchers_countalias for stars. - Open issues excludes pull requests. GitHub's
open_issues_countincludes PRs, so open PRs are counted separately and subtracted. - Contributors is the number of GitHub accounts on the repo's contributors list. Commits from emails not linked to a GitHub account are not counted.
- Release downloads is the sum of
download_countover every asset of every GitHub release. It counts downloads of binaries from GitHub only.pip/pipx/uvinstalls are not included; those show up in PyPI. The downloads chart appears once at least 14 daily snapshots exist. - PyPI downloads come from pypistats.org
overall?mirrors=false. pypistats keeps only the last 180 days, so this repo snapshots them daily to keep a longer history. Nothing before the first backfill (2026-03-17) can be recovered from pypistats. The first stored day may be incomplete. CI runs, mirrors, and caches make these counts approximate; treat them as a trend, not a user count. - Not tracked: container image pulls (GHCR pull counts aren't readable with
GITHUB_TOKEN), and search-API based counts such as commits or PRs over time. The search API has result caps and indexing lag that make those drift, and they aren't needed here.
collect.pyfetches everything first and writes files only once every source succeeded, so a failed run never leaves partial rows. It retries 429s, 5xx errors, and network errors with backoff, honoring GitHub rate-limit headers.render.pyrenderscharts/*.svgwith matplotlib, writesdata/summary.json, and regenerates the numbers table above. Output is deterministic, so unchanged data produces no diff..github/workflows/collect.ymlruns both daily at 04:17 UTC (and on manual dispatch), then commits only if something changed. It needs no secrets beyond the built-inGITHUB_TOKEN.
Run it locally:
GITHUB_TOKEN=$(gh auth token) uv run collect.py   # add --full-stars to refetch all stargazers
uv run render.py- gptme/gptme, the project itself
- gptme timeline, the project's release and milestone history
- ActivityWatch/stats, the sibling project this was modeled on
- Bob, the agent who maintains much of gptme, keeps separate personal stats (his own PRs, commits, and sessions) at TimeToBuildBob/stats. The two are deliberately kept apart: numbers here are about gptme as a project, and numbers there are about Bob.