
singlehit converts the CAMRA dose-response modeling script into a reusable R
package. It fits exponential and approximate beta-Poisson models to grouped
binomial microbial response data and returns tidy results instead of writing
files into the working directory.
In plain terms: you gave subjects increasing doses of a pathogen and counted how many became infected at each dose. This package estimates the dose-response curve from those counts and reports numbers like the dose that infects half of those exposed, along with honest uncertainty bounds.
The package provides:
- validated import of dose, positive-response, and negative-response counts;
- a log-dose trend test;
- binomial maximum-likelihood fits for both mechanistic models, using a multi-start optimizer for reliable convergence (see below);
- broom/tidymodels-compatible
tidy(),glance(), andaugment()methods; - chi-squared goodness-of-fit and model-deviance comparisons, with AIC/BIC;
- observed-proportion or fitted-model binomial bootstraps;
- percentile parameter intervals and pointwise confidence curves; and
ggplot2model and bootstrap plots.
If you would rather not write R code, the singlehitapp Shiny app runs the same
analysis in your web browser. It is a separate package stored in the
app/ directory of
this repository, and each singlehit release includes the app at the same
version. Installing singlehit does not install the app, but installing the
app also installs the singlehit release it was built with:
install.packages("pak")                         # only needed once
pak::pak("seanthimons/singlehit/app@*release")  # the latest app and its singlehit
singlehitapp::run_app()                         # opens the app in your browser
To install a specific release, replace *release with its tag, for example
app@v0.4.0. On an older version of R, see
Older versions of R first.
The tabs, from left to right:
- Data: load a CSV/TSV/TXT file or the Ward rotavirus example data. A QMRA
wiki
.xlsxworkbook, or the bundled sample, goes to the Library tab instead. - Library: filter and plot QMRA wiki experiments, send one to Fit, or choose several to test for pooling.
- Pooling: test whether the chosen experiments can share one curve, and send the pooled data to Fit.
- Fit: the dose-trend test, parameter estimates, and goodness of fit.
- Compare: the recommended model and the full assessment.
- Bootstrap: confidence intervals, computed in the background.
- Plots: the fitted curves, with PNG download.
- Explore: build your own plots by dragging variables.
The app guide
walks through each tab. The app is licensed under GPL-3, while singlehit
remains MIT.
Check that your data can be fitted before you start. singlehit needs:
- at least 3 distinct doses, each greater than zero;
- more than 1 positive response in total, summed across all doses; and
- counts of positive and negative subjects for every dose, not just a response proportion. Every dose group must contain at least one subject.
Data that fail these checks are rejected with an explanatory error. See Input data format for column names and the full rules.
singlehit isn't on CRAN yet, so you install it straight from GitHub. To do
that you need a helper package — either pak (recommended) or devtools.
You only have to install the helper once; after that it stays on your machine.
Option A — pak (recommended, faster):
# 1. Install the helper (only needed once, ever)
install.packages("pak")

# 2. Install singlehit from GitHub
pak::pak("seanthimons/singlehit")
Option B — devtools:
# 1. Install the helper (only needed once, ever)
install.packages("devtools")

# 2. Install singlehit from GitHub
devtools::install_github("seanthimons/singlehit")
Run these lines at the R console (the > prompt). If you're asked to install or
update other packages, say yes. Once it finishes, load the package like any
other:
library(singlehit)singlehit and the app contain no compiled code, but some of their dependencies do. CRAN provides ready-to-install (binary) versions of packages only for the current R release and the one before it. With an older R, packages may be installed from source, which can be slow and may fail without compilers (Rtools on Windows, Xcode on macOS).
Posit Public Package Manager (P3M) provides binaries for several older R versions as well, on Windows, macOS, and common Linux distributions. Point R at it before installing anything, including pak:
options(repos = c(CRAN = "https://packagemanager.posit.co/cran/latest"))
install.packages("pak")             # if you don't have it yet
pak::repo_add(CRAN = "PPM@latest") # adds your Linux distribution's binaries
pak::pak("seanthimons/singlehit")   # or the app, as shown in "Shiny app"
These settings last only for the current R session. The first line also covers devtools users. On Linux, pak itself still installs from source; see pak's installation guide for a binary. If your R is older than P3M covers, update R.
Every entry point (as_dose_response(), read_dose_response(),
analyze_dose_response()) expects three columns, one row per dose group:
| Column | Auto-detected aliases | Rule |
|---|---|---|
dose |
dose |
numeric, finite, > 0 |
positive |
positive, pos, positive_response |
non-negative whole number |
negative |
negative, neg, negative_response |
non-negative whole number |
Detection lowercases names and replaces punctuation with underscores, so
Dose, POS, and Positive.Response are recognized. Other names require
explicit mapping or renaming, as shown below. Rows sharing a dose are
summed, and the standardized output adds total (positive + negative) and
response (positive / total). For fitting to proceed the data must have
at least 3 distinct doses and more than 1 positive response in total.
The bundled ward_rotavirus dataset shows the required shape:
library(singlehit)

ward_rotavirus
#> # A tibble: 8 x 3
#>       dose positive negative
#>      <dbl>    <dbl>    <dbl>
#> 1    0.009        0        7
#> 2    0.09         0        7
#> 3    0.9          1        6
#> # i 5 more rows

as_dose_response(ward_rotavirus) # standardized: dose, positive, negative, total, responselibrary(dplyr) # supplies %>% for the renaming exampleA data frame or a tibble from tibble::tribble() works the same way. Recognized
aliases need no renaming:
counts <- data.frame(
  dose = c(1, 10, 100),
  pos = c(1, 5, 9),
  neg = c(9, 5, 1)
)
as_dose_response(counts)
Names such as dose_amount, infected, and uninfected are not recognized
aliases. This table has valid values, but automatic column detection fails:
trial <- tibble::tribble(
  ~dose_amount, ~infected, ~uninfected,
             1,         1,           9,
            10,         5,           5,
           100,         9,           1
)
tryCatch(as_dose_response(trial), error = function(e) message(conditionMessage(e)))
#> Could not detect the dose column; supply its name explicitly.
Map the original names with quoted strings. This leaves trial unchanged and
returns the standardized columns:
mapped <- as_dose_response(
  trial, dose = "dose_amount", positive = "infected", negative = "uninfected"
)
mapped
Or rename the columns before calling as_dose_response(). In dplyr::rename(),
the new name goes on the left:
renamed <- trial %>%
  dplyr::rename(dose = dose_amount, positive = infected, negative = uninfected) %>%
  as_dose_response()
identical(mapped, renamed)
#> [1] TRUE
Mapping or renaming only fixes column detection. Doses must still be finite
numeric values greater than zero, counts must be non-negative whole numbers,
and every row must contain at least one subject. as_dose_response() also
rejects fewer than three distinct doses or at most one positive response in
total. A total column or a response proportion does not replace the required
positive and negative counts.
The three count columns remain sufficient for a single dataset. To keep track
of your experiment, add study_id, host, dose_unit, and endpoint.
study_id identifies one experiment, not a publication. endpoint names the
measured outcome, such as infection, illness, or death; response is the
calculated proportion of subjects with that outcome.
Start with the blank CSV template or the completed example. The example counts are illustrative. Open the template in a spreadsheet, enter one row per dose group, and save it as CSV. Enter dose and counts as numbers, without units or percent signs. Repeat the experiment details on every row.
# Try the bundled example before reading your own CSV.
example_path <- system.file("extdata", "dose-response-example.csv", package = "singlehit")
trial <- read_dose_response(example_path)
trial

# For your own data:
# trial <- read_dose_response("my_trial.csv")
# Or, if it is already a data frame:
# trial <- as_dose_response(my_data)
Metadata columns are optional and are preserved through coercion and fitting.
When supplied, each identity column must have one non-blank value throughout
the dataset. Keep different experiments, hosts, dose units, and endpoints in
separate tables. Additional columns, such as citation or exposure route, are
also preserved; values must agree between rows sharing a dose before their
counts can be summed. total and numeric response are always recalculated.
For multiple experiments, keep the pathogen name once alongside the collection:
trial_a <- read_dose_response("trial_a.csv")
trial_b <- read_dose_response("trial_b.csv")
collection <- list(
  pathogen = "Rotavirus",
  datasets = list(trial_a = trial_a, trial_b = trial_b)
)
poolability_test(collection$datasets)
This list is an organizational convention, not a validated collection object.
The pooling functions refuse datasets whose dose_unit metadata differ, since
doses in different units are not comparable. They do not check hosts or
endpoints, so confirm those match before testing poolability. Recording
matching metadata does not by itself establish that experiments should be
pooled.
The bootstrap refits each model to thousands of resampled datasets to put
uncertainty bounds on the results. The exact beta-Poisson fit and large
bootstraps (thousands of replicates) can take minutes to hours, depending on
your computer. Start with a small number of replicates (for example
bootstrap_times = 200) to check your pipeline, then scale up.
mirai runs the bootstrap refits on background R processes, so the run finishes sooner on a multi-core machine and the R console can stay free while it works. It is optional: with the default settings, bootstraps above 1,000 replicates use it when it is installed, and otherwise run one after another in your current R session. Using mirai can reduce the wait.
Mirai also works after devtools::load_all(): local workers load the same
checkout before starting the bootstrap.
Bootstrap runs above 1,000 replicates automatically use mirai when it is
installed and show completion progress while results are collected. If no
daemons are already configured, the package starts a temporary
pool using 75% of the machine's detected physical cores and removes that pool
after collecting the result. Supply workers to override that default:
analysis <- analyze_dose_response(
  ward,
  bootstrap_times = 10000,
  seed = 2026,
  workers = 12
)
Existing mirai daemons are reused and remain under caller control. Use
backend = "sequential" to disable automatic parallelization, or configure a
pool explicitly:
mirai::daemons(4)
analysis <- analyze_dose_response(ward, bootstrap_times = 10000)
mirai::daemons(0)
Bootstrap samples are generated before parallel dispatch, so the same seed
produces identical results with backend = "sequential" and
backend = "mirai". Only the model refits are sent to workers.
For a non-blocking bootstrap, start a job and collect it when the result is needed:
fit <- fit_dose_response(ward, "beta_poisson")
job <- bootstrap_dose_response_async(fit, times = 10000, seed = 2026)

# The R console is available while daemons fit the bootstrap samples.
result <- collect_bootstrap(job)library(singlehit)
# system.file() locates a data file bundled inside the installed package.
# For your own data, replace this with a path to your file, e.g. "my_data.txt".
ward_path <- system.file("extdata", "Ward_rotavirus.txt", package = "singlehit")
ward <- read_dose_response(ward_path)
analysis <- analyze_dose_response(
ward,
bootstrap_times = 10000,
resample = "observed",
seed = 2026
)
analysis$assessment # headline verdict: which model is recommended
bootstrap_confint(analysis$bootstraps$beta_poisson) # parameter and ED10/ED50 intervals
ggplot2::autoplot(analysis)
plot_model_overlay(analysis) # all fitted models in one panel, without confidence bandsSee vignette("getting-started") for a narrated start-to-finish walkthrough that
interprets every output.
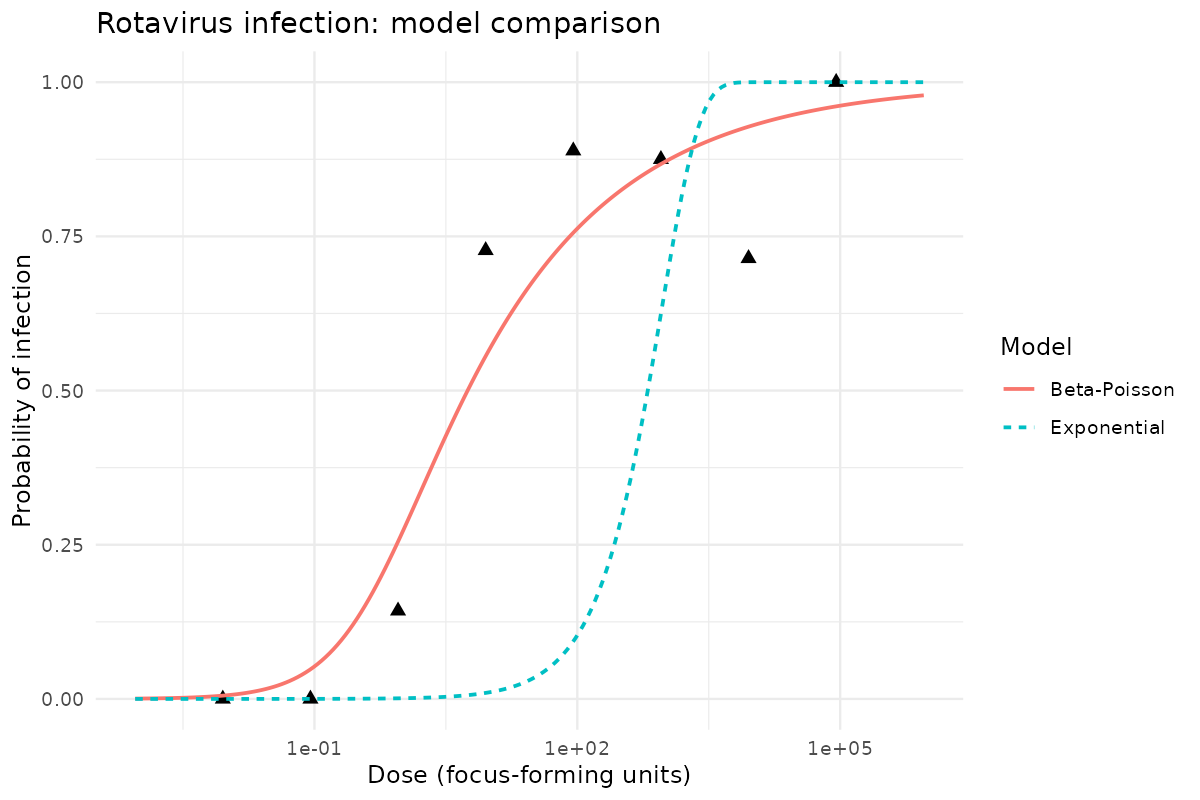
The Ward rotavirus model comparison shows the exponential and beta-Poisson curves with observed infection responses.
By default the workflow fits the exponential and approximate beta-Poisson
models. The exact beta-Poisson model (confluent hypergeometric form,
parameterized in alpha/beta) is available as a deliberate opt-in via the
models argument. It participates fully in fitting, the N-model comparison,
assessment, consensus, and plotting. Because it is roughly an order of magnitude
slower to fit, its bootstrap replicate count is controlled separately
(exact_bootstrap_times, default 10000; set to zero to fit and compare it
without bootstrapping). The exact fit and its bootstrap are the slowest
part of the workflow, so see Bootstrapping and run time
before running large replicate counts:
analysis <- analyze_dose_response(
  ward,
  models = c("exponential", "beta_poisson", "exact_beta_poisson"),
  bootstrap_times = 10000,       # exponential + approximate beta-Poisson
  exact_bootstrap_times = 10000, # exact beta-Poisson (slower); 0 to skip
  seed = 2026
)When no starting values are supplied, fit_dose_response() fits the model from
several candidate starting values and keeps the highest-likelihood result. A
single starting value cannot avoid every start-dependent local optimum across
the range of real dose-response data — for example an exponential fit to
beta-Poisson-shaped data, or a low-infectivity pathogen whose responses appear
only at the highest doses. Validated against the QMRA-wiki reference dataset,
this multi-start strategy reproduces the CAMRA reference fits far more reliably
than a single fixed start. Supplying start explicitly (as the bootstrap
warm-start does) uses that value alone, so bootstrap performance is unaffected.
When several trials exist for one pathogen, poolability_test() runs the Haas
likelihood-ratio test to decide whether they can be combined: it fits each
dataset separately and the stacked combination, then compares the deviance
difference to a chi-squared distribution (per model). Datasets that pool
significantly worse than when fit separately are kept distinct.
group_datasets() extends this to find which trials are mutually poolable.
Datasets that record dose_unit must all record the same unit; mixed units are
an error.
trials <- list(trial_a = data_a, trial_b = data_b, trial_c = data_c)

poolability_test(trials) # are they poolable? (one row per model)
poolability_combinations(trials) # each pair and larger combination, per model
group_datasets(trials)   # which trials group together (per model)
To see which combinations pass or fail, use poolability_combinations().
For three trials it reports A+B, A+C, B+C, and A+B+C. combination identifies
the trials, model identifies the fitted model, p_value reports the test
result, and poolable is TRUE when the pooled fit does not worsen
significantly at the chosen alpha. Inspect converged before trusting a
result. The datasets list column retains the exact trial names.
The report includes overlapping combinations; it does not select a final
grouping. group_datasets(trials, method = "exhaustive") searches all ways to
divide the trials into non-overlapping groups and selects one grouping per
model. The default grouping method instead merges compatible groups greedily.
Combination reporting and exhaustive grouping both default to at most six
trials because their searches grow rapidly. These are exploratory tests without
multiple-testing adjustment; passing a test does not prove equivalence.
Compare only experiments with matching hosts, units, and endpoints.
Decide which experiments belong together (same isolate, outcome, host, and
route) before testing, and use poolability_combinations() and
group_datasets() to check that choice rather than to make it: with few doses
per study the test rarely rejects, different searches return different
groupings, and a group chosen from the results biases its pooled fit toward
pooling. Also check that experiments do not share subjects, since the test
assumes independent samples. The
pooling article
walks through these points with real Cryptosporidium challenge data.
Datasets are combined by stacking — each trial's dose groups are kept as separate binomial observations, so repeated doses across trials are preserved (matching the QMRA-wiki pooled-experiment convention), rather than summed.
The bundled pooling-example.csv contains artificial counts for three
experiments, A, B, and C, with 100 subjects at each of four doses. A and B have
similar curves; C has a much lower response. These are teaching data, not
observations from a real pathogen.
path <- system.file("extdata", "pooling-example.csv", package = "singlehit")
raw <- readr::read_csv(path, show_col_types = FALSE)
collection <- list(
  pathogen = "Synthetic example",
  datasets = split(raw, raw$study_id)
)
report <- poolability_combinations(collection$datasets)
report[c("combination", "model", "p_value", "poolable", "converged")]
group_datasets(collection$datasets, method = "exhaustive")
The combination report prints:
# A tibble: 8 × 5
  combination model         p_value poolable converged
  <chr>       <chr>           <dbl> <lgl>    <lgl>
1 A + B       exponential  9.40e- 1 TRUE     TRUE
2 A + B       beta_poisson 9.25e- 1 TRUE     TRUE
3 A + C       exponential  2.50e-66 FALSE    TRUE
4 A + C       beta_poisson 9.60e-62 FALSE    TRUE
5 B + C       exponential  4.06e-67 FALSE    TRUE
6 B + C       beta_poisson 4.31e-62 FALSE    TRUE
7 A + B + C   exponential  5.24e-87 FALSE    TRUE
8 A + B + C   beta_poisson 1.19e-79 FALSE    TRUE
Read the multi-experiment CSV before splitting by study_id. Passing the whole
file to read_dose_response() would correctly reject mixed experiment IDs.
At alpha = 0.05, A+B passes for both models, while A+C, B+C, and A+B+C fail.
All fits converge, and exhaustive grouping puts A and B together with C separate.
A and B are candidates for a shared fit; keep C separate. This pooling decision
does not establish adequate absolute model fit or create a pooled analysis.
Development notes and owner-requested workflow follow-ups live in TODO.md.
Boosterpak remains optional repository-development tooling. It is not a package
dependency and is not needed to install or use singlehit.
For development, the original Ward source file remains at
data/raw/Ward_rotavirus.txt. The legacy script is retained under dev/ as a
methodological reference; package functions do not source it or depend on its
global variables.